Hypothesis Testing and Confidence Intervals in Linear Regression
In this assignment, you’ll extend your previous work from Assignment 6 to include hypothesis testing and confidence intervals through simulations. You’ll enhance your interactive webpage to allow users to perform hypothesis tests on the slope or intercept of the regression line and generate confidence intervals based on simulations. Download the starter code here.
Instructions
- Extend Your Existing Code:
- Copy relevant code from your Assignment 6 to the starter code provided.
- New input fields for users to specify the intercept (β₀) and slope (β₁) are provided in the starter code, along with the mean (μ), variance (σ²), sample size (N), and number of simulations (S) from Assignment 6.
- Update the data generation to use these user-specified values (using
Y = β₀ + β₁ * X + μ + error). - Store the simulated slopes and intercepts from the data generation step for later use (done in the starter code using a session).
Modify the Webpage Workflow:
- Data Generation:
- Users input parameters for data generation and click a “Generate Data” button.
- Display the plots related to data generation (scatter plot, histograms).
- Hypothesis Testing:
- After generating data, users can input parameters for hypothesis testing.
- User Inputs:
- Parameter to Test: Allow the user to select whether to test the slope or intercept.
- Type of Test:
- Greater than ( > )
- Less than ( < )
- Not equal to ( ≠ )
- Provide a “Run Hypothesis Testing” button under the data generation results.
- The hypothesis testing should use the stored simulations from the data generation.
- Null Hypothesis:
- The null hypothesis will use the original slope or intercept specified during data generation.
- Confidence Intervals:
- Provide options for generating confidence intervals.
- User Inputs:
- Parameter for Confidence Interval: Allow the user to select the slope or intercept.
- Confidence Level: Allow the user to select a confidence level (e.g., 90%, 95%, 99%).
- Include a “Calculate Confidence Interval” button.
- The confidence interval calculation should use the stored simulations.
- Data Generation:
Hypothesis Testing Implementation:
- Simulation:
- Use the slopes or intercepts from the stored simulations as the distribution under the null hypothesis.
- Calculating p-value:
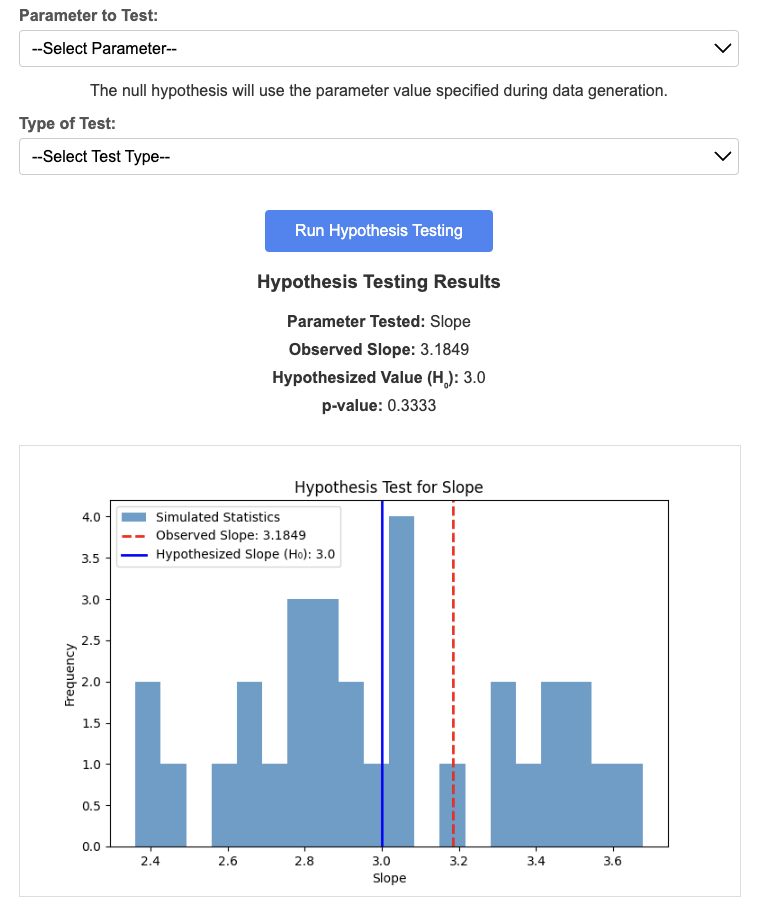
- Based on the type of test ( > , < , ≠ ), calculate the proportion of simulated statistics that are as extreme or more extreme than the observed statistic from your sample.
- For example:
- Greater than:
p-value = (number of simulated stats ≥ observed stat) / S - Less than:
p-value = (number of simulated stats ≤ observed stat) / S - Not equal to:
p-value = (number of simulated stats as extreme as observed stat) / S
- Greater than:
- Display the calculated p-value on your webpage.
- Handling Small p-values:
- Add code to display a fun message when the p-value is extremely small (e.g., ≤ 0.0001).
- This message should inform the user that they have encountered a rare event.
- Visualization:
- Plot a histogram of the simulated statistics.
- Mark the observed statistic and the hypothesized value on the histogram.
See below for an example of a histogram with a p-value calculation.

- Simulation:
Confidence Intervals Implementation:
- Simulation:
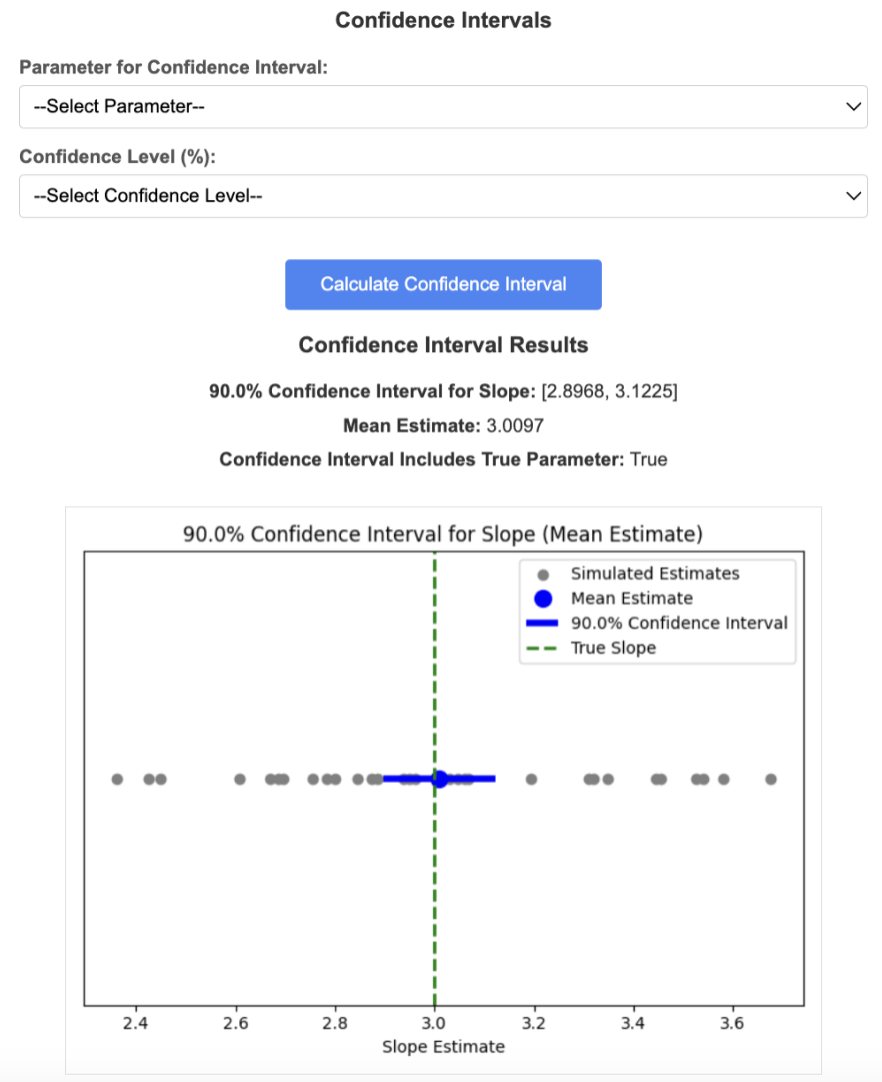
- Use the stored simulations to calculate the confidence interval for the mean estimate.
- Compute the mean and standard error of the simulated estimates.
- Calculate the confidence interval using the t-distribution.
- Visualization and Analysis:
- Plot the individual simulated estimates as gray points.
- Plot the mean estimate as a colored point.
- Plot the confidence interval as a horizontal line.
- Mark the true parameter value on the plot.
- Display whether the confidence interval includes the true parameter by changing its color.
See below for an example of confidence intervals with the true parameter value marked.

- Simulation:
Create a Short Demo Video (2-3 minutes):
- Explain the new additions to the webpage.
- Demonstrate your application with different inputs.
- Interpret the p-values obtained.
- Describe how the confidence intervals are constructed and their significance.
- Share any interesting patterns or observations from your experiments.
- Record your screen while doing a voiceover narrating the above content.
- Explain the new additions to the webpage.
Submission:
- Code:
- Submit your completed code as a GitHub repository on your portfolio website as you have done for previous assignments.
- Demo Video:
- Embed your video in your portfolio website either directly or from YouTube.
- Include the link to the video in your assignment repository’s README file.
- Code: